
CMC Markets
@t_CMC Markets

What symbols does the trader recommend buying?
Purchase History
پیام های تریدر
Filter
Signal Type
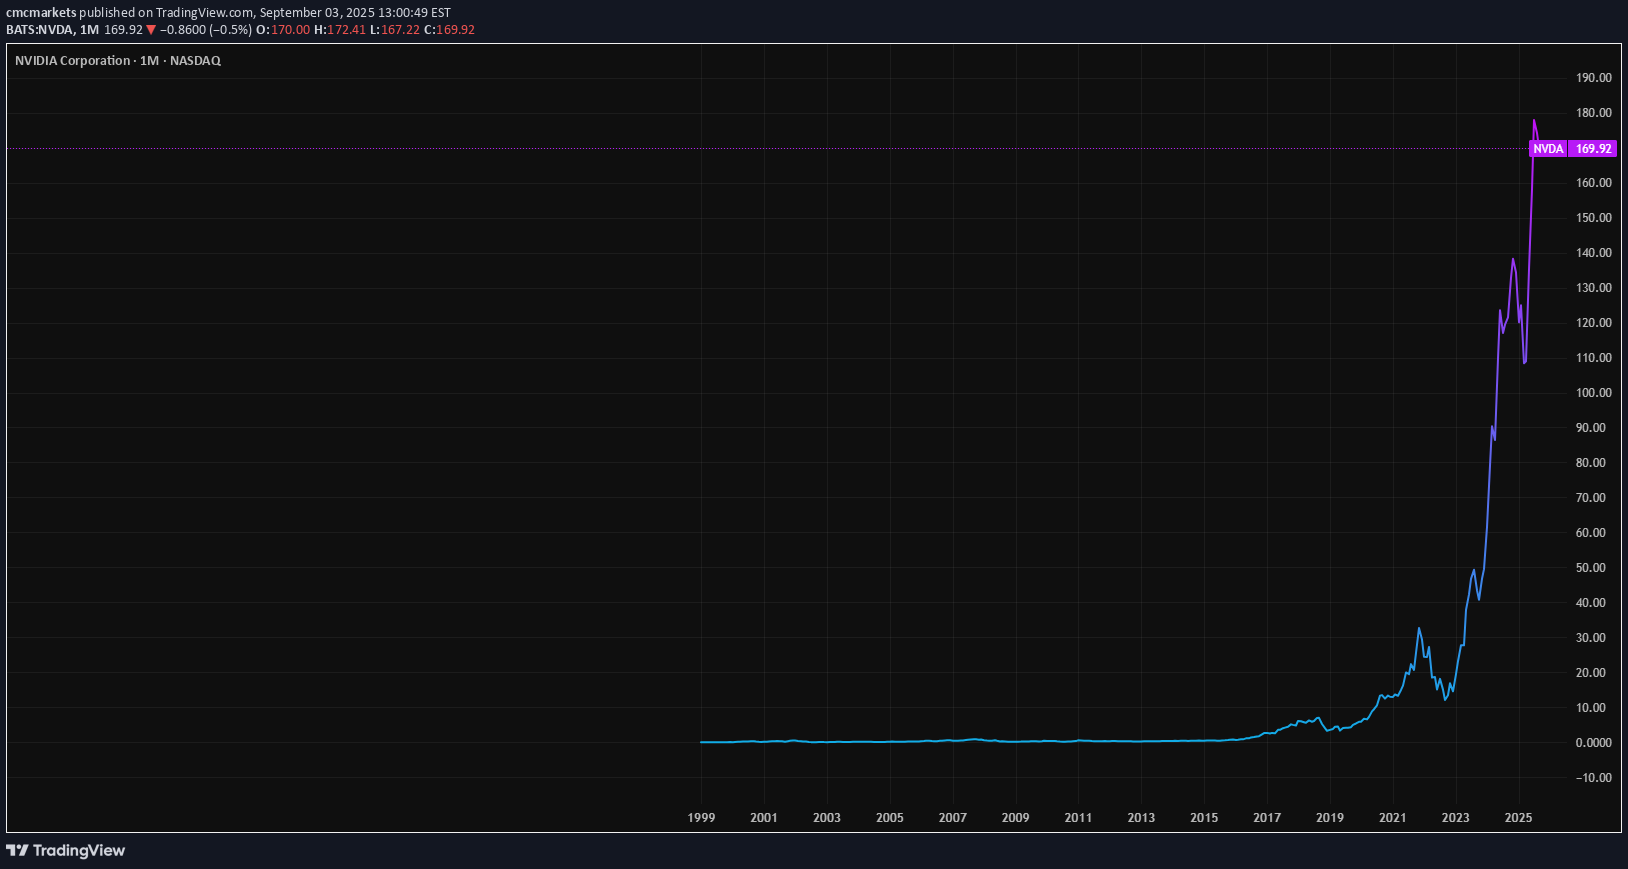
Nvidia shares have fallen by about 6% since the company reported results on 27 August. The stock has now reached an important inflection point, trading in a range between $165 and $170, which is a major area of technical support. If this support is broken, it could see the shares slip towards $150 — a further decline of around 12% from their price of roughly $171 on 2 September. The zone between $165 and $170 has acted as a support region on a few occasions since the gap higher on 15 July. That gap, however, was filled on 22 July, and it is possible that support at $165 has now been exhausted. This would mean that a retest of $165 could lead to the shares falling to their next support level, which is at the previous highs of $150. We have also seen a change in trend for Nvidia, with the stock now trading below a trend line that has been in place since early May. It is also trading below its 20-day moving average, which has started to turn lower. The relative strength index (RSI) confirms this change in trend, as it has also been trending lower. The RSI formed a bearish divergence in late July after climbing above 70, a point at which the RSI began making lower highs while the share price continued to make higher highs. If the stock is able to maintain support between $165 and $170, climb back above the 20-day moving average, and, more importantly, break the downtrend in the RSI, then it is possible that Nvidia could withstand this move lower and contain its losses, with an attempt to make another push towards all-time highs. Outside of that, the road ahead for Nvidia looks challenging. Written by Michael J. Kramer, founder of Mott Capital Management. Disclaimer: CMC Markets is an execution-only service provider. The material (whether or not it states any opinions) is for general information purposes only and does not take into account your personal circumstances or objectives. Nothing in this material is (or should be considered to be) financial, investment or other advice on which reliance should be placed. No opinion given in the material constitutes a recommendation by CMC Markets or the author that any particular investment, security, transaction, or investment strategy is suitable for any specific person. The material has not been prepared in accordance with legal requirements designed to promote the independence of investment research. Although we are not specifically prevented from dealing before providing this material, we do not seek to take advantage of the material prior to its dissemination.
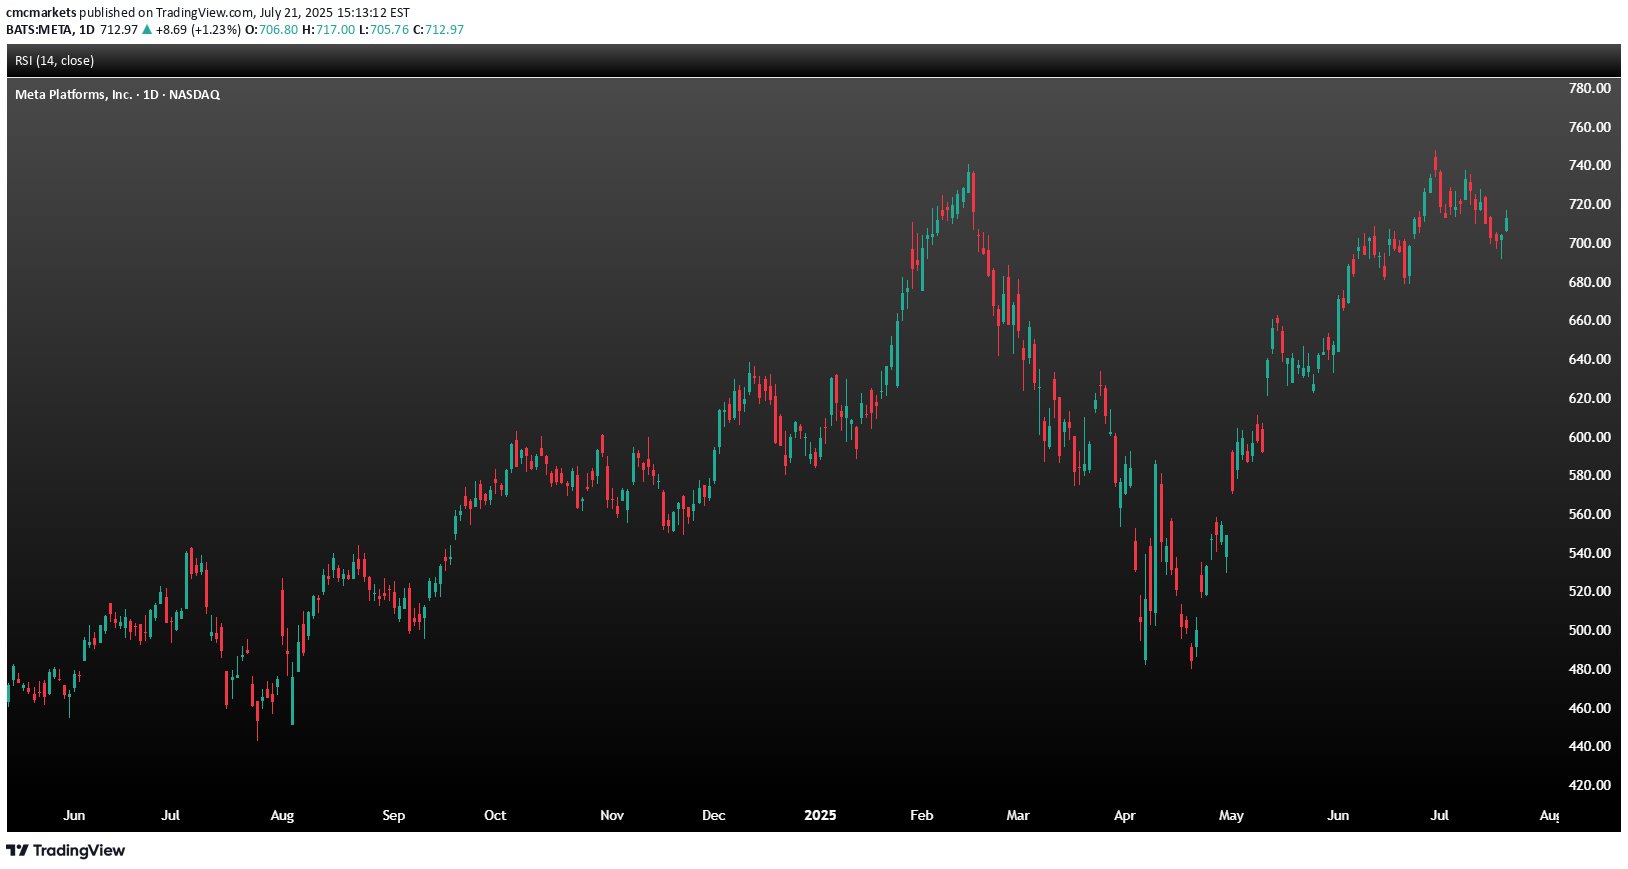
Meta (NASDAQ: META), the parent company of Facebook, will report second-quarter 2025 results on Wednesday, 30 July, after the close of trading in New York. The social media giant is expected to report that earnings growth slowed to 14.2% to $5.89 per share, as revenue growth decelerated to 14.4%, reaching $44.7 billion. CAPEX is expected to more than double from a year ago, increasing to $17.5 billion from $8.1 billion. For the third quarter, analysts expect the company to guide revenue to $46.0 billion. CAPEX for full year 2025 is forecast at $64.7 billion. The options market is pricing in a post-earnings move of about 6.5%. The stock has formed a potential 2B top reversal pattern when it briefly rose on 30 June, closed above the high seen on 14 February, but was unable to maintain it. Now, the stock has fallen below an uptrend that began on 1 May, as well as below technical support at around $705. Meanwhile, the Relative Strength Index has rolled over, suggesting momentum has shifted from bullish to bearish. There is considerable technical support for Meta between $680 and $700 per share, and a move below that support region could lead to the shares falling below $600 over time. From an option gamma perspective, $700 appears to be the put wall, which also suggests there is solid support around this level. However, the overall call delta values are high, indicating that the options market is very bullish. Therefore, after the company reports, it is possible there could be significant call value decay, leading to the unwinding of hedges and potentially pushing shares below the $700 support region. However, if the stock can hold support at $700, it stands a chance to move higher towards the call wall at $750 and potentially as high as $800. Written by Michael J. Kramer, founder of Mott Capital Management. Disclaimer: CMC Markets is an execution-only service provider. The material (whether or not it states any opinions) is for general information purposes only and does not take into account your personal circumstances or objectives. Nothing in this material is (or should be considered to be) financial, investment or other advice on which reliance should be placed. No opinion given in the material constitutes a recommendation by CMC Markets or the author that any particular investment, security, transaction, or investment strategy is suitable for any specific person. The material has not been prepared in accordance with legal requirements designed to promote the independence of investment research. Although we are not specifically prevented from dealing before providing this material, we do not seek to take advantage of the material prior to its dissemination.
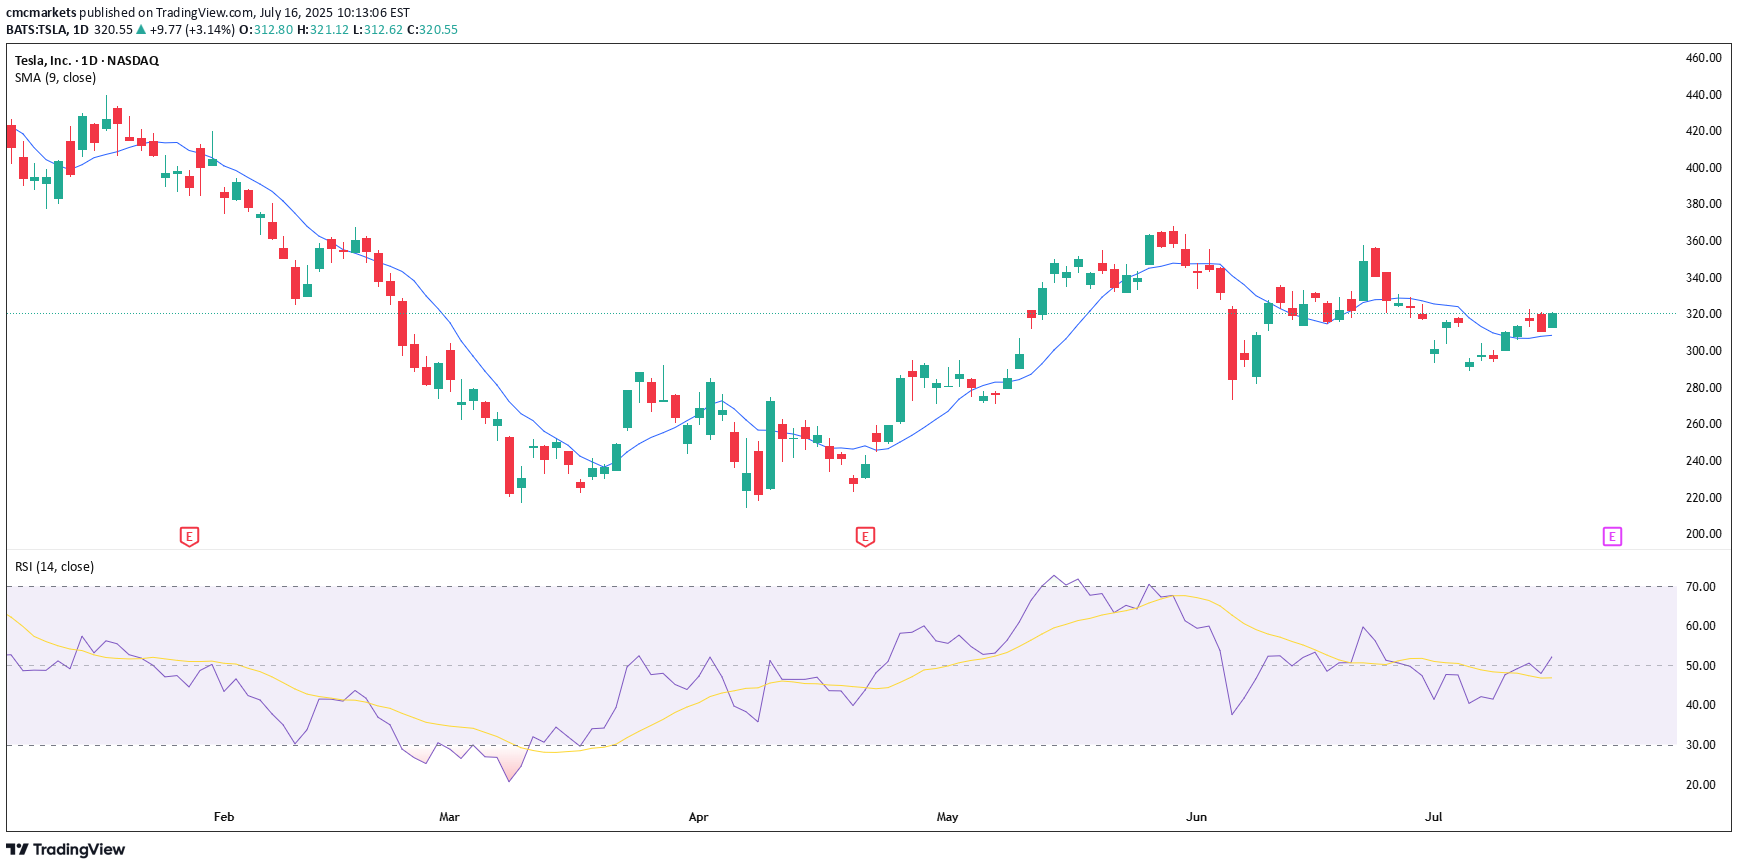
Tesla is scheduled to report its second-quarter results on Wednesday 23 July, after the New York close of trading. The company is forecast to report revenue of $22.8bn, representing a 10.5% year-on-year decline, with earnings expected to decrease 19% to $0.34 per share. Gross profit margins are also anticipated to contract by 2.3 percentage points to 16.4%, down from 18.7% last year. Tesla does not provide traditional guidance but instead offers a business outlook. In its first-quarter release, the company noted difficulties in assessing the impact of shifting global trade policies and stated it would revisit its 2025 guidance during the second-quarter update. Consequently, investors will undoubtedly be focused on any insights regarding 2025 delivery forecasts, especially given the weak performance in the first half of 2025. Given the current uncertainty, the market is pricing in a 7.5% rise or fall in the shares following the earnings release. Options positioning is relatively neutral, with only a slight bullish bias. However, there is significant support for the stock between $280 and $300, marked by substantial put gamma levels. Conversely, resistance from call gamma exists between $325 and $330. This setup suggests that it could be easier for the stock to rise rather than fall following the results. The technical chart clearly illustrates this scenario, highlighting strong support around $290 that dates back to March. More recently, the shares have encountered resistance around the $330 mark. If Tesla can successfully break above this resistance, the stock could move towards approximately $360, while downside seems limited to around $290 to $300. Written by Michael J. Kramer, founder of Mott Capital Management. Disclaimer: CMC Markets is an execution-only service provider. The material (whether or not it states any opinions) is for general information purposes only and does not take into account your personal circumstances or objectives. Nothing in this material is (or should be considered to be) financial, investment or other advice on which reliance should be placed. No opinion given in the material constitutes a recommendation by CMC Markets or the author that any particular investment, security, transaction, or investment strategy is suitable for any specific person. The material has not been prepared in accordance with legal requirements designed to promote the independence of investment research. Although we are not specifically prevented from dealing before providing this material, we do not seek to take advantage of the material prior to its dissemination.
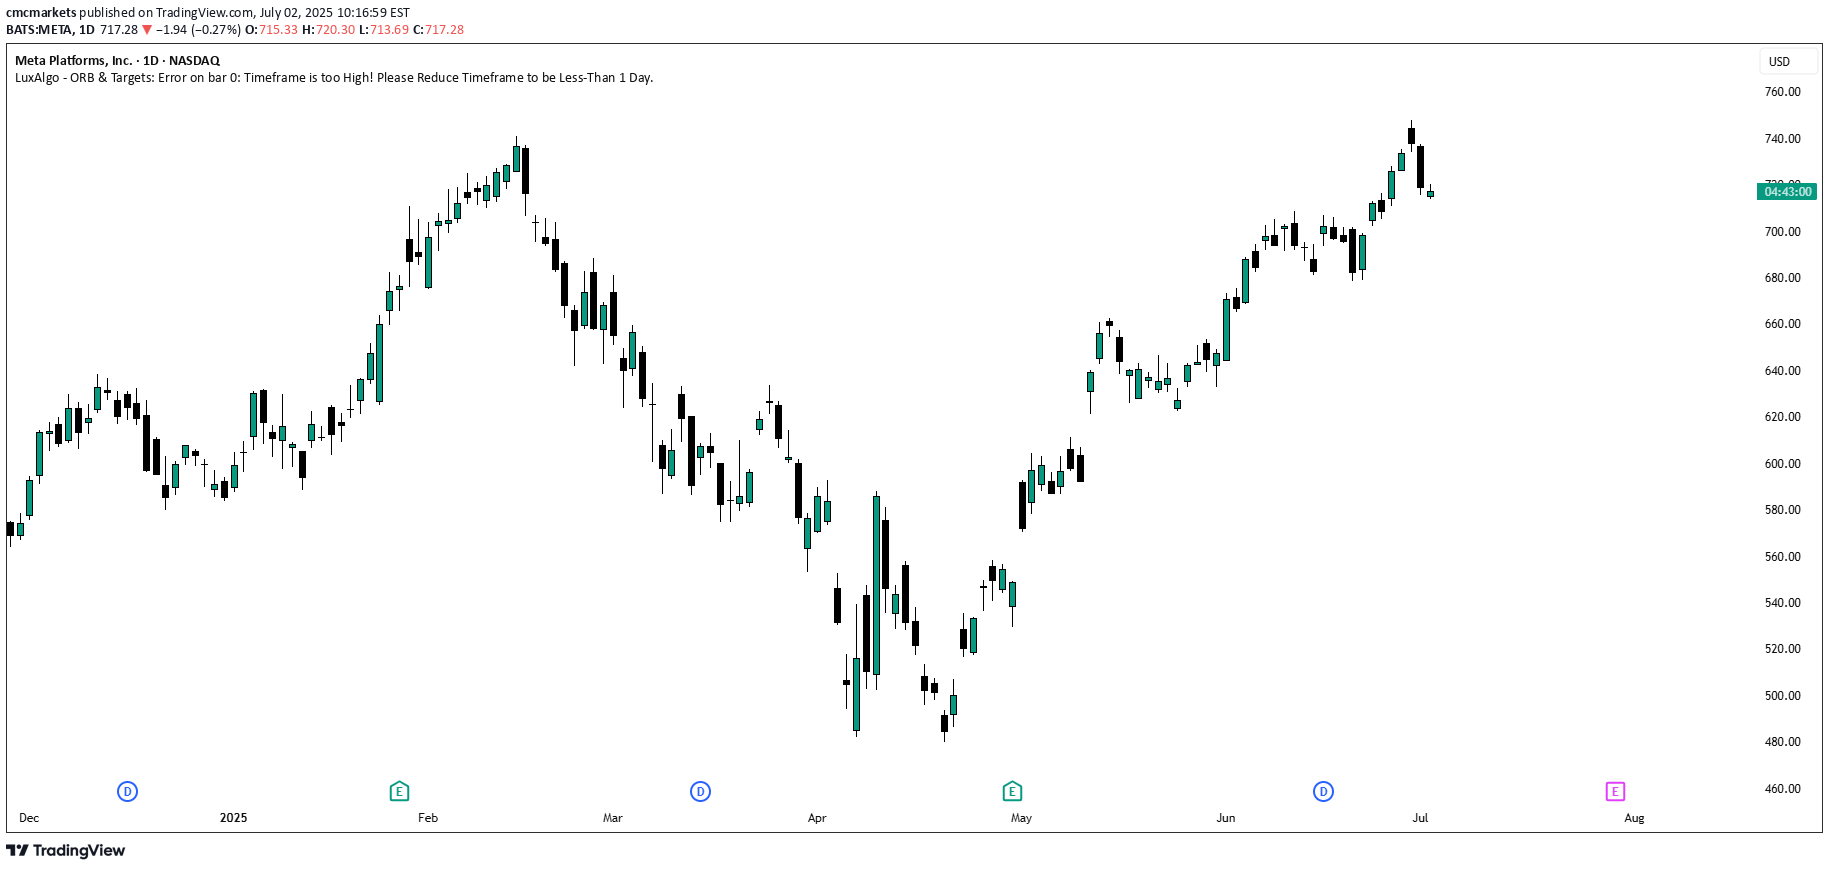
The shares of META, the NASDAQ-listed owner of Facebook, recently reached overbought levels as the stock price rose above its upper Bollinger Band and its Relative Strength Index climbed above 70. This suggests that META is likely to enter a period of sideways consolidation or perhaps experience a sharp decline. However, traders should also pay close attention to a potentially larger reversal pattern known as a 2B top, which may currently be forming. A 2B top is similar to a double top pattern, but typically the second high slightly exceeds the prior high before reversing. In this case, the high on 30 June 2025 exceeded the previous high set on 14 February 2025. The stock then fell sharply on 1 July, and if it continues to decline below support at $700, this would confirm the 2B topping reversal pattern. Additionally, a break below support at $700 would signal the end of the uptrend that began on 1 May and also push the price below the 10-day exponential moving average, further confirming a trend reversal. A decline below $700 could see the shares fall significantly, potentially erasing much of the gains recorded following the US-China trade negotiations held in Switzerland on May 12. Notably, a price gap exists at $593, created by the announcement following those talks. Alternatively, if the stock holds support at $700 and continues the uptrend, the 2b top is invalidated, and traders should look for even higher prices from this AI giant. The nice thing about the 2b topping pattern is that it provides an easy-to-identify invalidation price, which in this case would be above $748. Written by Michael J. Kramer, founder of Mott Capital Management. Disclaimer: CMC Markets is an execution-only service provider. The material (whether or not it states any opinions) is for general information purposes only and does not take into account your personal circumstances or objectives. Nothing in this material is (or should be considered to be) financial, investment or other advice on which reliance should be placed. No opinion given in the material constitutes a recommendation by CMC Markets or the author that any particular investment, security, transaction, or investment strategy is suitable for any specific person. The material has not been prepared in accordance with legal requirements designed to promote the independence of investment research. Although we are not specifically prevented from dealing before providing this material, we do not seek to take advantage of the material prior to its dissemination.

Gold is breaking down and may now have formed a double top pattern. The precious metal fell below the neckline of the double top at 3,230, which implies that gold prices have further to fall. A projection of that double top suggests that gold could fall to around $3,000.There is more at play here, suggesting that something deeper could be unfolding for gold. It had appeared to form a descending triangle, but instead of breaking lower, gold broke higher and climbed back to the previous highs around $3,400, allowing it to create the double top pattern. However, we now see that the base of the descending triangle became the neckline for the double top, and gold continues to hit and bounce off the downtrend that began on April 21. For now, gold is supported by that trend line and the Bollinger Band, presenting an opportunity for a potential bounce.In fact, if gold is still in an uptrend, this would be the most likely point for it to bounce. The concern, however, is that if gold has indeed formed a double top and falls to $3,000, it would break below an uptrend that began at the start of 2025—part of a larger bump-and-run pattern. This would create a more bearish medium-term outlook for gold. Typically, when a bump-and-run pattern breaks the initial trend line, it tends to resolve by falling to a lower, longer-term trend line, which in this case could be around $2,900.Right now, gold is at a critical juncture—if it doesn’t bounce, the likelihood of a larger decline increases significantly.Written by Michael J. Kramer, founder of Mott Capital Management. Disclaimer: CMC Markets is an execution-only service provider. The material (whether or not it states any opinions) is for general information purposes only and does not take into account your personal circumstances or objectives. Nothing in this material is (or should be considered to be) financial, investment or other advice on which reliance should be placed.No opinion given in the material constitutes a recommendation by CMC Markets or the author that any particular investment, security, transaction, or investment strategy is suitable for any specific person. The material has not been prepared in accordance with legal requirements designed to promote the independence of investment research. Although we are not specifically prevented from dealing before providing this material, we do not seek to take advantage of the material prior to its dissemination.

Gold prices have pulled back from the high reached on 22 April and, more importantly, are nearing a break from the recent period of consolidation. Gold is forming a descending triangle, which could provide clues about the direction prices will take.Typically, a descending triangle is considered a bearish continuation pattern. In this instance, gold has been drifting lower along a downtrend formed intraday on 22 April. Gold is approaching this downtrend line again, having failed to break above it on two previous attempts. A break above this line would be bullish and may sharply increase gold prices, with initial resistance around $3,370 per troy ounce, followed by the recent highs near $3,470.However, if the pattern is a descending triangle, gold may not break out above the downtrend line. Instead, it could break below support at $3,260, which currently forms the triangle's base. A break below this support could initially send gold back towards $3,210, although the larger risk is a more profound decline down to $2,975.For now, however, gold is also finding support at its 10-day exponential moving average (EMA), representing another critical level. A breakdown is unlikely if gold can hold above this moving average. Conversely, if gold slips below the 10-day EMA, it could confirm a short-term shift in trend and indicate further downside potential. Additionally, the relative strength index (RSI) is signalling a potential momentum shift, dropping below 70 and showing signs of bearish divergence.Written by Michael J Kramer, founder of Mott Capital Management Disclaimer: CMC Markets is an execution-only service provider. The material (whether or not it states any opinions) is for general information purposes only and does not take into account your personal circumstances or objectives. Nothing in this material is (or should considered to be) financial, investment or other advice on which reliance should be placed.No opinion given in the material constitutes a recommendation by CMC Markets or the author that any particular investment, security, transaction, or investment strategy is suitable for any specific person. The material has not been prepared in accordance with legal requirements designed to promote the independence of investment research. Although we are not specifically prevented from dealing before providing this material, we do not seek to take advantage of the material prior to its dissemination.

Gold appears to be showing signs of finally cracking after an impressive run higher, with the excitement surrounding its rally potentially approaching a crescendo. The precious metal experienced a sharp intraday reversal on 22 April, a decline that continued into 23 April. Since the recent uptrend began in mid-March, gold has consistently found support at its 10-day exponential moving average (EMA).For now, gold continues to hold just above this key support level; a break below the 10-day EMA could signal a heightened risk of further declines, potentially targeting $3,280 per troy ounce.Gold remains extremely overbought on the weekly chart, trading above the upper Bollinger Band, with the relative strength index (RSI) above 80. This suggests that gold could be due for a sideways consolidation or pullback towards the 10-week moving average at $3,100.Gold also remains overbought on the monthly chart, trading above the upper Bollinger band and with an RSI above 85. In this scenario, a break below $2,900 may lead to a decline towards the 10-month moving average of $2,800.It is not often that an asset class trades at such extreme levels, and this suggests that gold may be overdue for a period of consolidation, either by trading sideways and marking time or by pulling back to retest some of the moving averages situated at lower levels. It continues to indicate that overall gold’s upside may be limited.Written by Michael J Kramer, founder of Mott Capital ManagementDisclaimer: CMC Markets is an execution-only service provider. The material (whether or not it states any opinions) is for general information purposes only and does not take into account your personal circumstances or objectives. Nothing in this material is (or should considered to be) financial, investment or other advice on which reliance should be placed.No opinion given in the material constitutes a recommendation by CMC Markets or the author that any particular investment, security, transaction, or investment strategy is suitable for any specific person. The material has not been prepared in accordance with legal requirements designed to promote the independence of investment research. Although we are not specifically prevented from dealing before providing this material, we do not seek to take advantage of the material prior to its dissemination.

The diamond pattern in gold has played out, but instead of a reversal pattern, it acted as a continuation pattern this time. However, it is possible that the pattern has been completed, and gold could pause its recent rally before resuming its upward bias.Measuring from the top to the bottom of the diamond to project the move in gold from the breakout point suggests that the yellow metal, currently trading around $3,028 per ounce, has largely hit its objective.Additionally, gold has rallied beyond its upper Bollinger Band, which is currently acting as resistance and suggesting potential overbought conditions, supported by the relative strength index surpassing 70. With both indicators in overbought territory, gold could be due for a possible pause — either by consolidating sideways for a few days around the $3,025 to $3,050 region or by pulling back to retest the breakout at $2,950.That is not to say the rally is complete, as the breakout above $3,000 appears significant. After a brief pause, gold could continue rising towards $3,160, based on a projection of the rally that began on 18 December and lasted until 11 February.Gold falling below $2,950 would be a bearish signal, potentially indicating that the recent breakout was false, which could result in gold pulling back to around $2,850.
Disclaimer
Any content and materials included in Sahmeto's website and official communication channels are a compilation of personal opinions and analyses and are not binding. They do not constitute any recommendation for buying, selling, entering or exiting the stock market and cryptocurrency market. Also, all news and analyses included in the website and channels are merely republished information from official and unofficial domestic and foreign sources, and it is obvious that users of the said content are responsible for following up and ensuring the authenticity and accuracy of the materials. Therefore, while disclaiming responsibility, it is declared that the responsibility for any decision-making, action, and potential profit and loss in the capital market and cryptocurrency market lies with the trader.